REN R 580
Kenneth Oraiz
University of Alberta

Methods
Study Site
The study was conducted at the Breton Plots, University of Alberta (53°09′ N, 114°44′ W), a long-term agricultural research site in central Alberta. The site features loam-textured, Gray Luvisolic soils developed from moraine or glacial till parent material, representative of upland agricultural landscapes in the region. With a mean annual precipitation of approximately 564 mm, the area supports crop production under cool temperate conditions. The cropping system follows a two-year Wheat–Canola rotation, implemented from 2022 to 2025. For the current growing season, Canola (cultivar P511G), supplied by Pioneer Canada, was selected for its proven adaptability and agronomic performance in western Canadian environments.
.png)
Figure 3. Study area
Experimental Design
The experiment was laid out in Randomized Complete Block Design with a control with full and half rate of chemical fertilizer application and 8 treatments.

Figure 4. Experimental plot layout at Breton Plots, Breton, Alberta
GHG Collection
One rectangular static gas chamber (65 cm long×15 cm wide×15 cm high) was installed at randomly selected location in each plot. The GHG emissions are measured using the static chamber method (Gross et al. 2022). GHG samples were collected and are then collected on a 2-day interval for the first 10 days to capture the changes in GHG emissions in response to the treatments, then bi-weekly for the remaining season. The GHG samples are analyzed on a gas chromatograph for CO₂, N₂O and CH₄ concentrations. The GHG emission rates were calculated based on the changes in GHG concentrations over time. Soil temperature and moisture content were measured using probes.


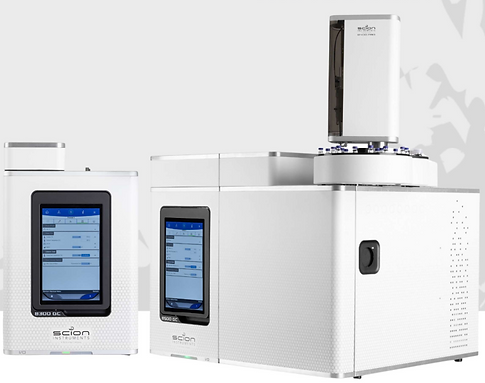
Figure 5. GHG collection and analysis using Scion 8500 GC
Soil Samples Collection and Analysis
Composite soil samples were collected in each plot at a depth of 0-15cm in each plot at harvest stage. The collected samples were sieved in 2mm sieve for soil analysis. Soil pH was measured potentiometrically with a pH meter (1:5 soil - water ratio), while electrical conductivity (EC) was assessed using a conductivity meter. Available nitrogen and ammonium concentrations were determined through colorimetric analysis. Total organic carbon (TOC) and total carbon (TC) were quantified using a TOC analyzer. Total nitrogen (TN) was measured via the combustion-based Dumas method. Microbial biomass carbon (MBC) and nitrogen (MBN) were estimated using the fumigation–extraction technique.


Figure 6. TOCN and MBCN Analysis using Elementar Analyzer and TOC-V Machine
Data Analysis
-
Data analysis was conducted in RStudio (version 2025.09.2) using the packages FactoMineR, factoextra, dplyr, and ggpubr. The dataset was cleaned by standardizing column names into concise, readable labels (CO₂ Flux, CH₄ Flux, N₂O Flux, pH, EC, Total N, Total C, MBC, and MBN). These variables were subjected to Principal Component Analysis (PCA) to reduce dimensionality and identify the main sources of variation among treatments.
-
Prior to PCA, all variables were standardized (z‑scores) to account for differences in measurement scales.
-
Eigenvalues and scree plots were examined to determine the proportion of variance explained by each principal component.
-
Variable contribution plots were generated to highlight the relative importance of soil properties and greenhouse gas fluxes, while PCA biplots were used to visualize correlations among variables and treatment effects.
-
Treatment clustering was further evaluated using ellipses to illustrate group separation. Figures were formatted with proper chemical notation (CO₂, CH₄, N₂O) and clear labels to ensure readability and suitability for publication.